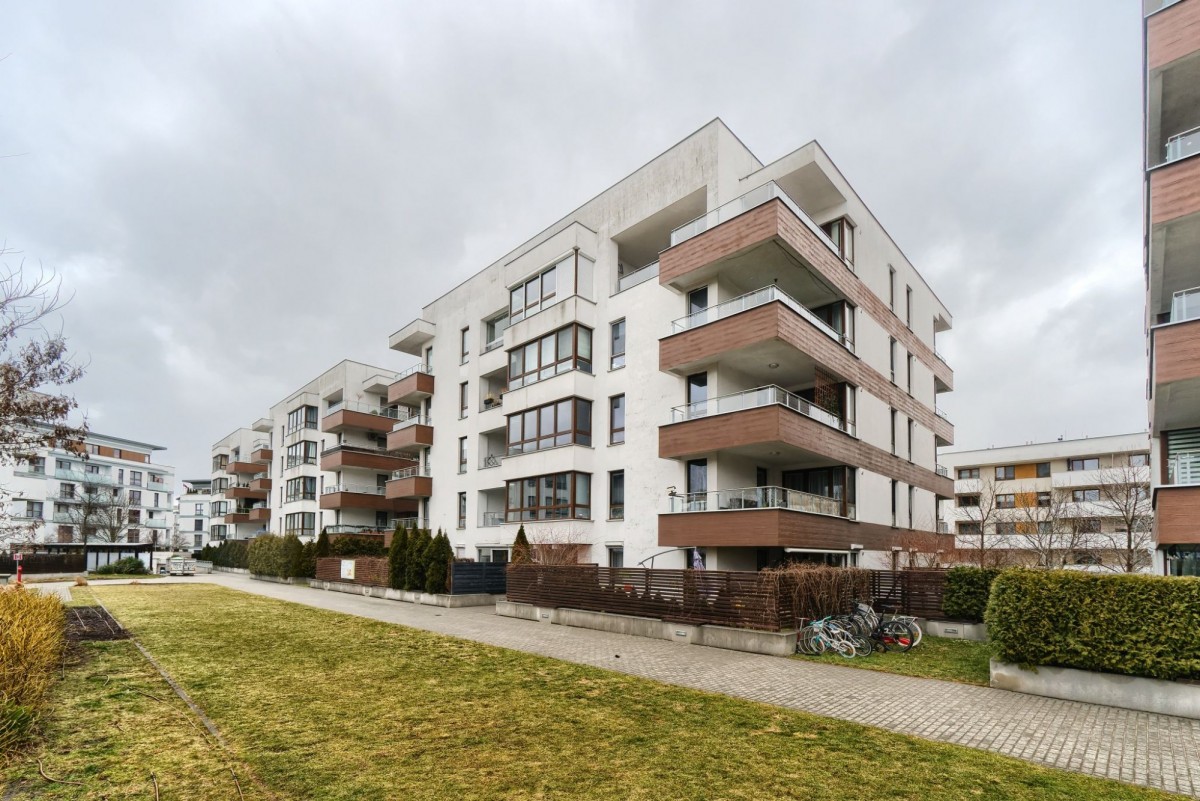
Housing stock in Warsaw

Housing stock in Warsaw
In March 2021, a population and housing census was carried out in Poland. Accordingly, this was done in Warsaw. We would like to tell you what the housing stock in Warsaw looks like according to the National Population and Housing Census (NSP) on March 31, 2021.
Based on statistical data, we analyzed the urban housing stock. Over the decade since the previous census (Table 1), the housing stock in the Polish capital increased by 184.4 thousand apartments or 21.6% and amounted to 1036.3 thousand apartments. The average number of rooms in an apartment has become smaller (3.09), and the average usable area has become larger (59 m2). This suggests that housing began to be built with fewer rooms, and the apartments themselves became larger.
Table 1. Residential premises in Warsaw according to census data
|
|
31.03.2011 |
31.03.2021 |
2021/2011,% |
2021/2011,% |
|
Apartments, thousand |
851,9 |
1036,3 |
184,4 |
121,6 |
|
Average number of rooms in an apartment* |
3,21 |
3,09 |
-0,12 |
96,3 |
|
Average usable area, m2* |
58,0 |
59,0 |
0,2 |
101,4 |
* Excluding apartments with an unknown number of rooms and unknown usable area
Now about the comfort of housing in Warsaw. As we can see from Table 2, the provision of apartments in Warsaw with utilities (water, sewerage) is close to 100 percent. It is clear that these utilities are only missing in older housing stock.
As for gas supply and heating, the lack of full coverage is explained by the transition to electricity supply for kitchens and individual heating of residential premises.
Table 2. Equipping apartments in Warsaw with communal amenities (in thousands)
|
Name |
Quantity |
Specific gravity,% |
|
The apartments are equipped with: |
|
|
|
water supply |
1002,2 |
96,7 |
|
toilets |
999,2 |
96,4 |
|
bathrooms |
989.4 |
95,5 |
|
network gas |
745,8 |
72,0 |
|
central heating |
765,6 |
73,9 |
Now let's talk about the construction of apartments that were commissioned in different periods of time in Warsaw (Table 3). To the statistical data, we took the liberty of adding calculations about the share of apartments built during official periods of time and the average annual housing commissioning within the same period.
It turns out to be a very interesting picture. Before the end of World War II, 85.0 thousand apartments were built in Warsaw (10.2% of the total). However, this indicator should be treated with caution. During the war, 72% of the housing stock in the capital was destroyed.
In the post-war period, the city was being restored and new construction was developing. The largest number of apartments were built in Warsaw between 1945 and 1970. - 264.6 thousand apartments or 31.8% of the total housing stock as of 2011.
The next period (1971-1978) gave the largest annual increase in housing in Warsaw - 14.5 thousand apartments. During the last socialist period (1979 – 1988), annual housing construction in Warsaw declined sharply. This is explained by radical changes in the country, a crisis in the state, financial and economic system.
By the way, on average, in the capital of the Polish People's Republic (PPR) until 1988, 10.6 thousand apartments were commissioned annually.
Now for a closer story. Since 1989, a new historical period began in Poland. Along with it, housing construction began to gradually increase. In 1989 – 2002 An average of 9.5 thousand apartments were built annually, and in 2003-2011. their number on an annual average increased to an annual figure of 16.7 thousand apartments. This is the maximum figure for the entire observed period.
In just 23 years of capitalist development in Poland, one third of housing has been introduced in Warsaw, and the average annual construction of apartments was 12.1 thousand.
Table 3. Number of apartments built in different periods of time in Warsaw (in thousands)
|
Time period |
Quantity |
Specific gravity,% |
Average per year (thousands) |
|
before 1945 |
85,0 |
10,2 |
|
|
1945 – 1970 |
264,6 |
31,8 |
10,18 |
|
1971 – 1978 |
116,0 |
14,0 |
14,5 |
|
1979 – 1988 |
86,0 |
10,4 |
8,6 |
|
1989 – 2002 |
132,6 |
16,0 |
9,5 |
|
2003 –2011* |
146,5 |
17,6 |
16,3 |
|
Total |
830,7 |
100 |
12,4 |
* Including apartments in houses under construction
And finally, we present to your attention data on the ownership of apartments in Warsaw by type of owner (Table 4). It shows that the largest amount of real estate is owned by individuals - 681.5 thousand apartments, or slightly more than two-thirds. Next come apartments owned by housing cooperatives - 214.7 thousand units or slightly more than 21 percent. The state and communes still own only 87.7 thousand apartments, which is 8.6%. All other organizations account for 2.6% of apartments.
Table 4. Ownership of apartments in Warsaw by type of owner (in thousands)
|
Owner |
Quantity apartments |
Specific gravity,% |
|
Housing cooperatives |
214,7 |
21,3 |
|
Gminas (municipal) |
71,0 |
7,0 |
|
Companies |
4,4 |
0,4 |
|
State Treasury |
16,7 |
1,6 |
|
Individuals |
681,5 |
67,5 |
|
Social construction societies |
3,8 |
0,4 |
|
Other organizations |
18,4 |
1,8 |
|
Total |
1010,5 |
100 |
Thus, we have examined the housing stock of the Polish capital based on official data over time. We think it was interesting.
Blog


Nowy Dwór Mazowiecki
Nowy Dwór Mazowiecki (Nowy Dwor Mazowiecki) is a city in the Mazowieckie Voivodeship of Poland. Included in the Warsaw agglomeration. It is located at the mouth of the Narew River at the confluence wi

Mokotow. Microdistrict (obszar) „Czerniaków” (Czerniaków)
Mokotow. Microdistrict (obszar) „Czerniaków” (Czerniaków)


