Change in the population of Warsaw for the period 1981 - 2021
Change in the population of Warsaw for the period 1981 - 2021
(Total, including men and women, thousand people)
1981 ...... 1611,6 752,4 859,2
1982 ...... 1628,9 760,9 868,0
1983 ...... 1641,3 766,7 874,6
1984 ...... 1649,1 770,6 878,5
1985 ...... 1659,4 776,8 882,6
1986 ...... 1664,7 779,2 885,5
1987 .......1671,4 782,5 888,9
1988 ...... 1651,2 772,3 878,9
1989 .......1651,2 772,4 878,8
1990 .......1655,7 773,1 882,6
1991 ...... 1653,3 771,9 881,4
1992 .......1644,5 763,3 881,2
1993 .......1642,7 762,3 880,4
1994 ...... 1640,7 760,7 880,0
1995 .......1635,1 757,9 877,2
1996 .......1628,5 754,2 874,3
1997 .......1624,8 752,2 872,6
1998 ...... 1618,5 748,5 870,0
1999 .......1615,4 747,2 868,2
2000 .......1672,4 774,7 897,7
2001 ...... 1671,7 773,8 898,0
2002 .......1688,2 780,9 907,3
2003 ...... 1689,6 780,4 909,2
2004 .......1692,9 781,6 911,3
2005 .......1697,6 782,3 915,3
2006 .......1702,1 783,5 918,7
2007 .......1706,6 784,8 921,8
2008 .......1709,8 786,3 923,5
2009 .......1714,4 787,9 926,5
2010 ...... 1700,1 780,3 919,8
2011 .......1708,5 783,8 924,7
2012 .......1715,5 786,9 928,6
2013 .......1724,4 791,2 933,2
2014 .......1735,4 796,2 939,3
2015 .......1744,4 800,8 943,6
2016 .......1754,0 805,4 948,6
2017 .......1764,6 810,8 953,8
2018 .......1778,0 817,7 960,3
2019 .......1790,7 824,3 966,3
2020 .......1861,8 858,8 1003,0
2021 .......1863,1 859,7 1003,4
Blog
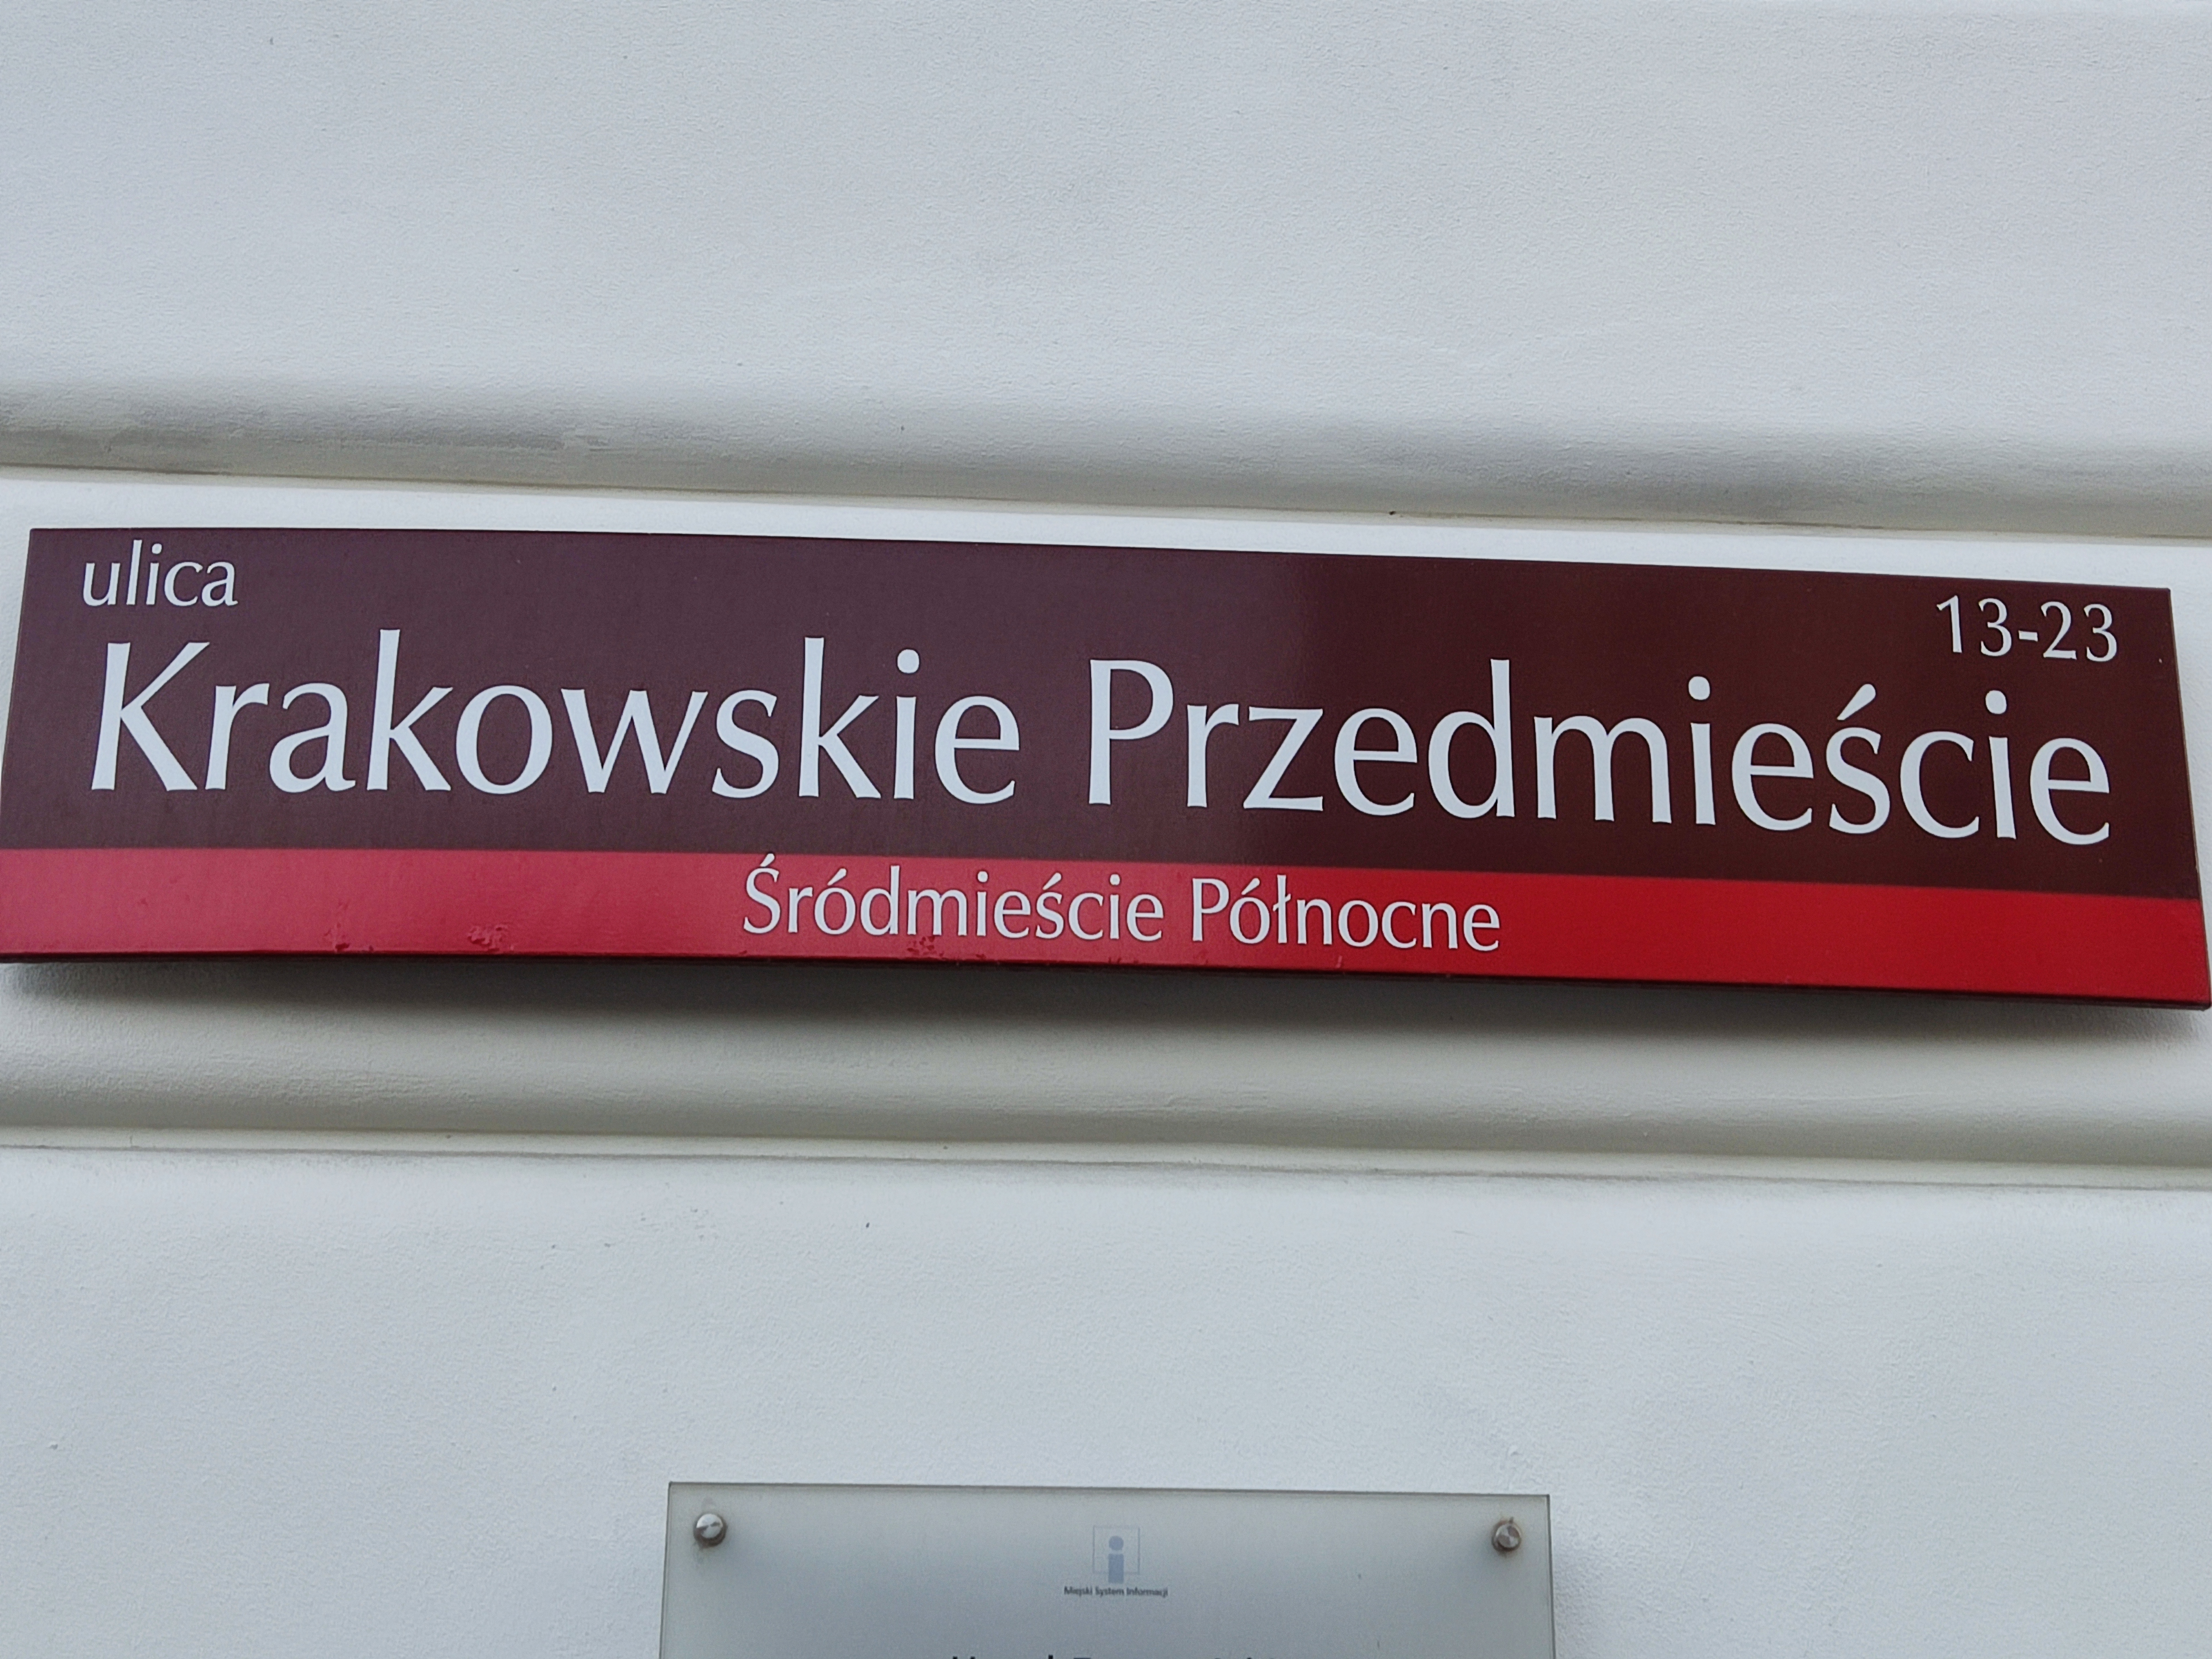
An address sign on the house is required
An address sign on the house is required
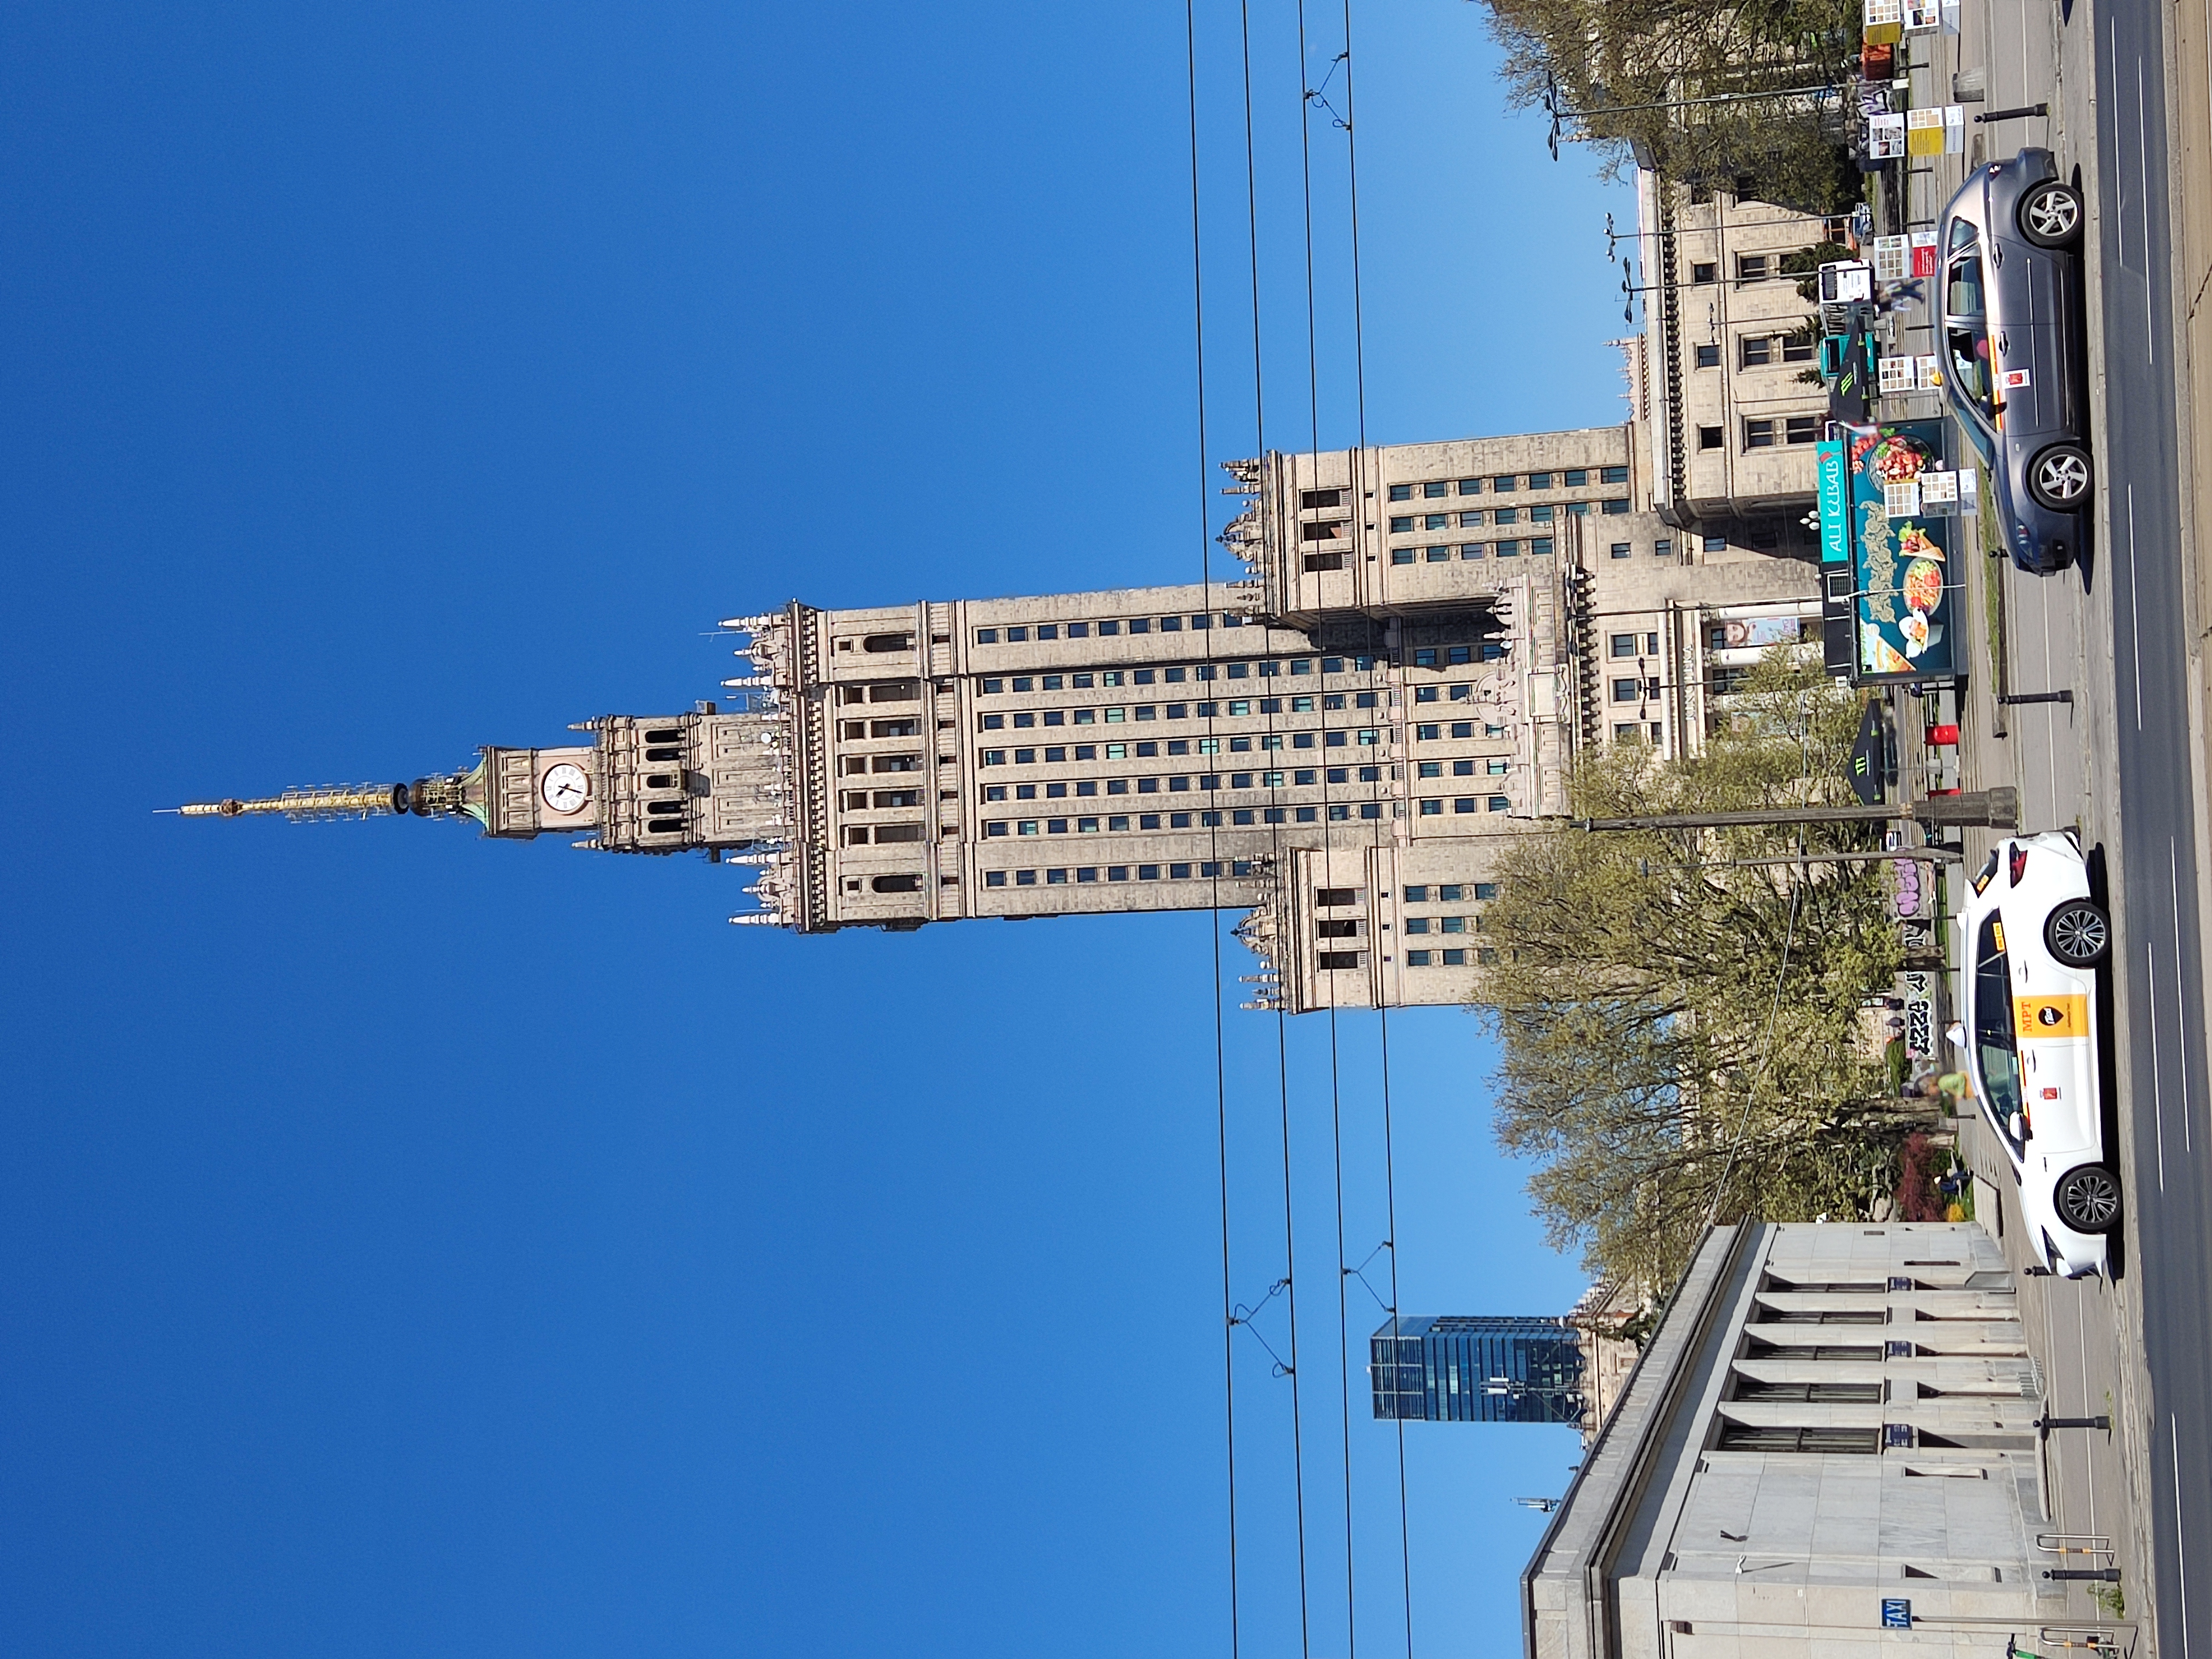
The first skyscrapers in Warsaw
Among the first skyscrapers in Warsaw are the following 3 high-rise buildings (PAST building, 1910, height 51.5 m; Hotel Warszawa 1933, 66 m; Palace of Culture and Science 1955, 237 m).